Follow this link to go to the text only version of nasa.gov
Follow this link to skip to the main content
NASA Home
+
+
+
NASA Home
Rayleigh Scattering rayleigh scattering

+ LaRC Home
Go
Click to return to home page
research areas page
Click to visit facilities page
Click to visit Personnel pages
Click to view branch Organizational Chart
Click to view site map
   
  molecular based flow diagnostics subheading   relevant links


publications


Rayleigh Example 1:
Scattering measurements in supersonic facilities
+ Download

Rayleigh Example 2:
Planar Rayleigh scattering results in helium-air mixing experiments in a Mach-6 wind tunnel

+ Download

Rayleigh Example 3:
Flow Visualization by Elastic Light Scattering in the Boundary Layer of a Supersonic Flow

+ Download

Rayleigh Example 4:
Flow Visualization of Density in a Cryogenic Wind Tunnel Using Planar Rayleigh and Raman
Scattering

+ Download

Research Interests: Dr. Paul Danehy
+ Download

Publication List: Dr. Herring
+ Download


Rayleigh Scattering

Single point or planar measurements of gas velocity and/or density in non-seeded, high speed flows.


Rayleigh Graphic


Rayleigh Scattering Measurement Technique


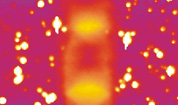
Rayleigh-Based Flow Density Visualization: Four Examples

Rayleigh Scattering Measurement Technique

Example 1: Hypersonic

  1. Hypersonic airflow at Langley’s High-Temperature, Mach-6 Tunnel
  2. ArF-excimer laser at 193 nm
  3. No seeding required
  4. Comparison of stream-wise CFD image & 5-sec-average Rayleigh measurements in flow over right-circular cylinder


Example 2: Scramjet

  1. Hypersonic airflow at Langley’s High-Reynolds Number, Mach-6 Tunnel
  2. ArF-excimer laser at 193 nm
  3. Fuel injection simulated with He
  4. Instantaneous visualization of He-air mixing with 10-nsec laser light sheets (transverse to stream-wise direction)


Example 3: Supersonic

  1. Supersonic airflow at Langley’s Unitary Plan Wind Tunnel (Mach-2.5)
  2. Nd:YAG laser at 532 nm
  3. No seeding required
  4. Instantaneous visualization of upper region (~ 1-2 cm off surface) of turbulent boundary layer
    with 10-nsec pulses


Example 4: Subsonic

  1. Subsonic pure N2 flow at Langley’s 0.3-Meter Transonic Cryogenic Tunnel (5 amagat, 100 K)
  2. Nd:YAG laser at 532 n
  3. Executed with and w/o CO2 seeding
  4. Instantaneous visualization of uniform-density free-stream with 10-nsec pulses suggests that the laser light sheet is randomly perturbed by turbulent boundary layer of sidewall


FirstGov - Your First Click to the US Government
+ Freedom of Information Act
+ Budgets, Strategic Plans and Accountability Reports
+ The President's Management Agenda
+ NASA Privacy Statement, Disclaimer,
and Accessibility Certification

+ Inspector General Hotline
+ Equal Employment Opportunity Data Posted Pursuant
to the No Fear Act

+ Information-Dissemination Priorities and Inventories
Click to visit the NASA Homepage


NASA Official: Lisa Le Vie
Page Curator: Lisa Le Vie
Last Updated: April 2017
+ Contact NASA