| |
| |
|
|
| |
|
|
| |
|
|
| |
|
| |
|
|
| |
|
Virtual Diagnostics Interface (ViDI) Powerpoint
+ Download |
| |
|
|
| |
|
|
Virtual Diagnostics Interface (ViDI)
ViDI is an enhanced visualization environment. The whole of ViDI is currently encompassed by four components, three of which the user can directly interact with. These are the pre-test experimental visualization, real time interactive data visualization during an experiment, and post-test data analysis. Another essential component, all but invisible to the end user, is Seamless Data Transfer (SDT). SDT is the binder that facilitates automated data handling and storage so the researcher can manipulate the information content of the data without the need to spend time manipulating the format of the file. The ultimate goal of ViDI is to create a user-friendly set of tools to dramatically increase the efficiency in which experiments and experimental data can be planned and analyzed in conjunction with computational results. Each element of ViDI mentioned above exists, each in varying levels of technological maturity. This document will briefly introduce the parts of ViDI, and touch upon future plans that will make these tools available for projects like the Orbital Space Plane and beyond. ViDI Part I: Pre-Test Planning
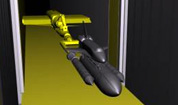
Line of sight access is crucial for optical based techniques. This extends beyond the needs of just the sensor, as proper illumination from lamps or lasers is just as critical. The task of optimally setting up illumination sources and cameras around a wind tunnel may be time consuming, with trial and error often the modus operandi. This is compounded by the difficulties introduced when the region of interest around a model moves due to angle of attack, roll, or yaw changes. To optimize the experimental design phase, a three-dimensional computer model of the facility, the experimental model, and any relevant portions of the surroundings are developed. Using this geometry within a sophisticated PC–based COTS modeling and animation software package, the user may manipulate cameras, lights, lasers, the test configuration, mounting hardware and any other physical elements with the move of a mouse. Numerous “what-if” scenarios can be implemented, allowing the engineers and technicians to devise the best solutions or compromises. In addition, the pre-test investigation eliminates surprises and misunderstandings that can lead to time-consuming (i.e. expensive) re-working of test setups. 
Figure 1. ViDI pre-test planning project for a test that utilized PIV, PMI, PSP, DGV, microphone array, static pressure tap, laser light sheet, and oil flow, with some instruments running simultaneously for a Unified Instrumentation Experiment. ViDI planning led to the successful implementation of each test element.
Next >>
|