| |
|
|
| |
|
|
| |
|
|
| |
|
| |
|
|
| |
|
Virtual Diagnostics Interface (ViDI) Powerpoint
+ Download |
| |
|
|
| |
|
|
Virtual Diagnostics Interface (ViDI)
Readiness Level – Mature This aspect of ViDI has been used for several years with great success for numerous wind tunnels at NASA Langley, NASA Ames, and Wright Patterson Air Force Base. Instrumentation supported includes PIV, PSP/TSP, PMI, and DGV, Laser Light Sheet visualization, surface oil flow.
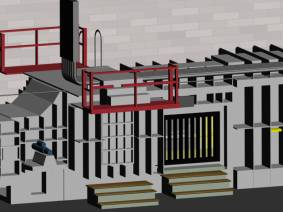
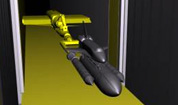
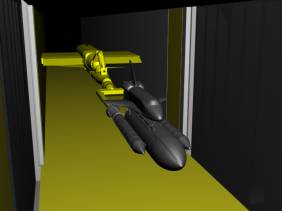
Figure 2. IGES shuttle stack CAD file from Johnson Space Center imported into the ViDI Virtual Facility of the Langley Unitary Plan Wind Tunnel. (Note: Very early mock-up concept depicted, geometry changes anticipated.)
Future Development:
Use the extensive programming language within the PC-Based COTS visualization software to create easy to use interfaces allowing novice CAD users to quickly and efficiently plan out additional experiments for these facilities.
ViDI Part II - Real Time Data Visualization
ViDI currently has the capability of displaying two live video streams within the virtual environment in real time. Thus video imagery of a laser light sheet or a schlieren system can be incorporated into the three-dimensional computer geometry to represent the data with respect to the test configuration, sting, and wind tunnel (or any portion of these). In addition, the model may include data from other sources, such a surface pressure or flow field velocities, either experimental or computational in origin.
Future Development:
Given the appropriate video framegrabber hardware, video from any source may be imported into the virtual environment and mapped to any sort of geometry. The bottleneck for real time visualization is the need for data processing. Certain image processing routines, such as false coloring and enhancement routines performed in real time by the framegrabber software and/or specially “tuned” image processing libraries will be added in the near term. Multiple cameras systems are already being developed.
ViDI Part III – Data Visualization
Ten years ago, the need for a virtual environment to support instrumentation was first driven by the desire display image based data in a three-dimensional environment. To date, data from DGV, PSP, PIV, PMI, and laser light sheet, oil flow, Schlieren and Laser Velocimetry and computational fluid dynamics (CFD) have been imported into ViDI. Most importantly, when more than one type of data is available for a given configuration, these data sets can be displayed simultaneously, enhancing the ability to better understand both the test conditions and physics. The multiple data sets may allow the user to see both the cause of a condition and the effect it has on the surrounding environment.
|