| |
|
|
| |
|
|
| |
|
|
| |
|
| |
|
|
| |
|
Virtual Diagnostics Interface (ViDI) Powerpoint
+ Download |
| |
|
|
| |
|
|
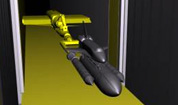
Virtual Diagnostics Interface (ViDI)
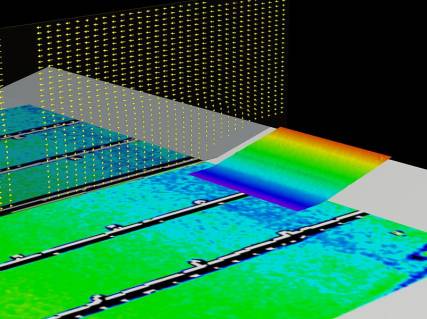
Figure 3. Unified data visualization of PSP (surface pressure), PIV (flow velocity vectors) and PMI (leading edge deflection) data in-situ from the Unified Instrumentation Experiment depicted in Figure 1.
Readiness Level – Experimental data: Mature, but not automated.
Computational data: Early stages
Data in the form of images have been manipulated using ViDI for nearly a decade. Today the process is well established, but potentially labor intensive based in the type and quality of the data. Experimental data can be displayed on complex three-dimensional surfaces (PSP, TSP, PMI, oil flow), and as planar data in the form of a color contour map or velocity vectors within the confines of a laser light sheet (PIV, DGV, LV). Schlieren data can be displayed with the test geometry along the plane in which it acquired. The planar data sets can be manipulated to create “stained glass” effects in which the data is partially transparent, allowing the user to see through to better judge the physical relationship between the data and the model geometry.
Multiple data sets can also be displayed simultaneously. Several planes of data can be depicted, and the planar data can be combined with on surface measurements. Numerous variations are possible based on the needs of the researcher. However, the data source is not limited to experiment. Computational data may be combined with the experimental data both to compare with and compliment the experimental data.
Importing computational data is an evolving technique within ViDI. Recently a data converter was written which allows surface data values to be represented by coloring the geometry faces as is common in CFD visualization software, as opposed to creating separate texture maps and applying them to the model (as is currently done with most of the image based experimental data). Direct side-by-side experimental and computational comparisons of data have been achieved. However, unlike the other aspects of ViDI, more development time will be required before a stand alone “deliverable” software package can be deployed.
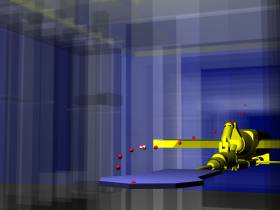
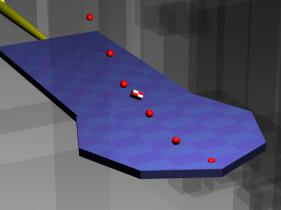
Figure 4. Two views from a concept demonstration exercise depicting ViDI support for the Unitary Plan Wind Tunnel flat plate Debris Tracking experiment. The trajectory of a rectangular object is depicted, with red spheres indicating the measured trajectory coordinates. Intermediate points are determined through iteration by the computer. The wind tunnel is depicted as “glass” for reference without being overly distracting to the viewer. This data set was ultimately animated to show the flight of the object.
|